Pssst... want an easy way to stay ahead of weekly consumer trends?
Subscribe to our newsletter
Pssst... want an easy way to stay ahead of weekly consumer trends?
Subscribe to our newsletter


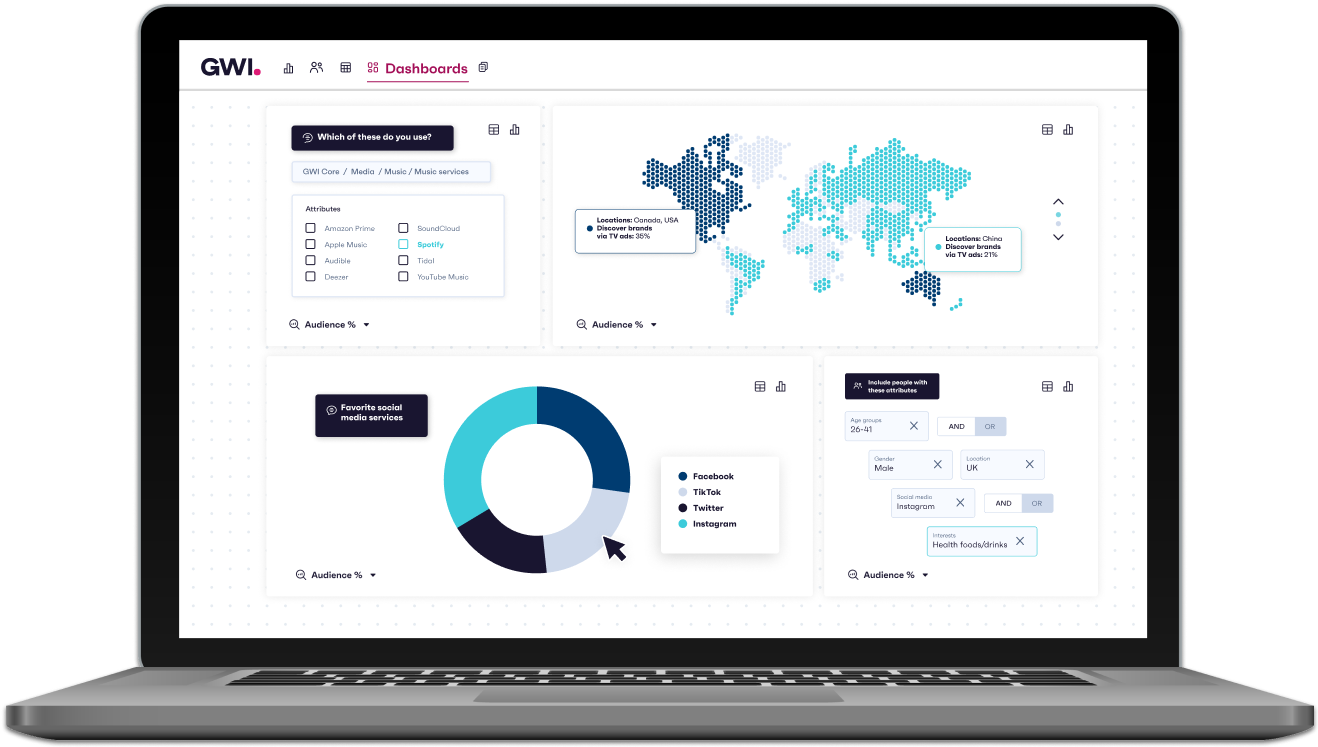
As we prepare to open the Global Web Index platform to launch subscribers, we thought we would take the opportunity to share some screen shots of how it looks and how the subscriber can get the most out of the data set regardless of familiarity with research.
Analysis:
Trend presentations are published constantly through the year covering all aspects of the data, providing unique insights and thinking. You can search by tags, download to PowerPoint or Excel and share with your team. These presentations will tackle many interesting areas that come out of the data, including topics such as content creation segmentation, understanding the relationship between traditional media and social media and why Asia leads the way in content creation.
Data Tool:
We have teamed up with Confirmit to create an extremely user friendly data tool, which is as simple or detailed as you need it. You can customise charts, export the data into PPT or excel and you can filter them to provide the focus you need. If you want to go further you can run your own crosstabs so you can build complex audiences, or analyse the relationship between different aspects of behaviour. We will show you more of the data tool as we go live.